Analyse-it transforms Microsoft Excel into a world-class statistics package. Discover more about your data with powerful statistical analysis and data visualisation.

Editions

Click on the Edition to see more information and pricing

Analyse-it Standard Edition

#
#

Analyse-it Standard Edition

Analyse-it integrates into Microsoft Excel to provide you with a wide-range of statistics and charts for visualising, describing and testing hypotheses.
 

Analyse-it integrates into Excel ’97 to 2007 and provides a toolbar of dataset management and statistical tests so you can analyse data directly from your worksheet. Staying in the familiar Excel environment means there is virtually no learning curve. You don't have to export your data to another package and you won't end up with your data locked into an inaccessible, proprietary, file format.
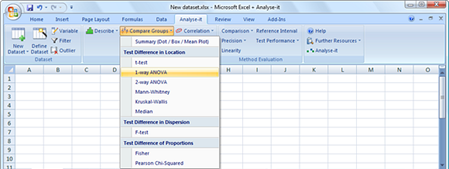
 

Analyse It Integrated into Excel


Analyse-it integrates into Excel, providing a wide-range of statistics and charts for you to explore your data and test hypotheses.
 

Explore, visualise and test sample distribution

Analyse-it provides extensive descriptive statistics and insightful charts for exploring samples. Statistics include the mean, median and standard deviation, all with confidence intervals, plus many non-parametric measures such as quartiles and percentiles.


Box-whisker plots, mean-plots, percentile and standard deviation plots let you see how observations are distributed and spot outliers. A frequency histogram, with optional normal curve overlay, provides an alternative view of the sample distribution. Histogram bins can be determined automatically by Analyse-it or you can enter your preferred bins.

Tests and charts include:

  • Summary statistics

  • Frequency histogram with configurable bins

  • Box-whisker plots, with near- and far- outliers

  • Dot-, Mean-, Percentile- and SD plots

  • 1-sample z-test

  • 1-sample t-test

  • Binomial test

  • Runs test
     

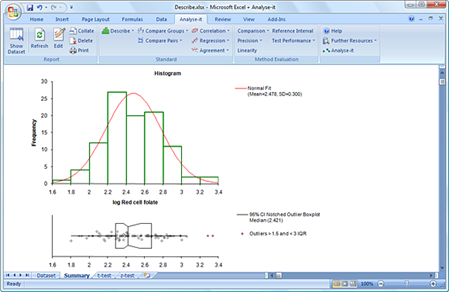
Box Whisker and Frequency Histogram


Analyse-it provides many charts for exploring and visualising your data. Frequency histogram and dot- and box-whisker plot, with notch indicating median confidence interval, are shown.


Verify pre-test assumptions of normality

Tests and charts are included for verifying a sample is normally distributed - a necessary step when using parametric statistics. Hypothesis tests are included so you can formally test normality, or you can use the normal quantile plot and frequency histogram (with normal overlay) to make a visual assessment.


Tests and charts include:

  • Kolmogorov-Smirnov

  • Shapiro-Wilk (supports up to 5,000 observations)

  • Anderson-Darling

  • Normal Quantile plot

  • Frequency histogram with normal overlay


Find changes and differences between groups and samples

Parametric procedures including the t-test and ANOVA, with post-hoc comparisons, are provided so you can test whether groups/samples change due to a factor or over time. For non-normal and categorical data non-parametric procedures are provided, including Mann-Whitney, Kruskal-Wallis, Fisher exact, and Chi-Square.
 

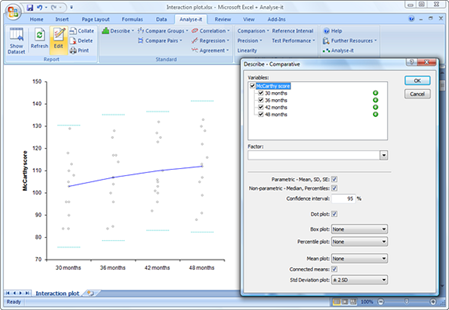
Side-by-side dot-plots, box-whisker plots and mean-plots let you visually compare samples. Interaction plots, with connected means, let you easily see whether samples or groups differ or change.
 

Tests and charts include:

  • Independent and paired t-test

  • Mann-Whitney and Wilcoxon Signed ranks

  • 1-way ANOVA, with LSD, Bonferroni, Tukey, Dunnet and Scheffe post-hoc comparisons

  • 1-way repeat-measures and 2-way ANOVA

  • Kruskal-Wallis and Friedman ANOVA

  • Sign and Median test

  • F- test

  • Fisher exact and Chi-Square

  • McNemar and Cochran tests

  • Side-by-side dot-plots, box-whisker plots, mean-plots and SD plots

  • Interaction plot (connected means)
     

Interaction Plot
 

Publication-quality print-ready reports

Analyse-it's perfectly formatted reports mean you can print the analysis immediately, without wasting time tidying them up for presentation. You can also copy-paste charts and statistics directly into your own documents and presentations. Chart look is based on the most popular formats used in published research, so charts are immediately ready for inclusion into research papers.


Save, exchange and update your analyses

Once analysed, your Analyse-it analyses can be saved in a standard Excel workbook, published on the intranet, or e-mailed to colleagues. Colleagues with Excel can open and print workbooks containing Analyse-it analyses, without needing Analyse-it. At any time you work with Analyse-it, you can update analysis reports, repeating the analysis to reflect changes or additions to the source data.


A proven reliable product

Analyse-it has is used by over 15,000 customers world-wide. It's widely respected by researchers and is cited in well over 1,500 published peer-reviewed papers in internationally recognised journals.
 

Full support and help along the way

All major upgrades to Analyse-it, released within 12 months of your purchase, are available to free of charge. Bug fixes and minor updates are available free of charge, for the lifetime of the product.
 

If you need help or advice on using Analyse-it, the full help and tutorials included with Analyse-it provide easy-to-understand, plain English instructions to guide you through using Analyse-it. Help on choosing a suitable statistical test, then using, interpreting, and understanding the statistics is included. Most queries are answered within a few, and almost all within 24, hours.

Analyse-it Quality Control & Improvement Edition

#
#

Analyse-it Quality Control & Improvement Edition

Improve your products and services with statistical process control (SPC).

Ideal for anyone involved in manufacturing products, managing processes, or implementing a Six Sigma programme.

Meet your customers’ expectations and keep them satisfied with powerful statistical analysis to understand processes, bring them under control, and find improvements that better your product.


Bring processes under statistical control

Gain insight and improve process performance with Shewhart variable and attribute, CUSUM, and moving average control charts. Apply WECO, Nelson and Montgomery rules help identify possible out of control situations. And when you've implemented improvements, or made other changes, phases let you track performance before and after so you can ensure improvements have been made and are sustained.


Ensure products are meeting end-user specifications

Determine process capability indices for process performance to ensure you deliver products that meet your customers’ requirements. A happy customer means fewer rejected goods and service complaints, improving your business and lowering costs.


Identify improvements that will reap the most rewards

Pareto analysis helps you quickly identify commonly occurring defects so you can focus your efforts making improvements that will reap the most rewards. Stratification lets you break-down defects so you can identify contributing factors, such as an operator that is influencing defect rates, or look at defects before and after process improvements to ensure the changes are reducing defects.


Plus it includes the Analyse-it Standard Edition...

All the features from the Analyse-it Standard Edition are included so you can improve processes and products by identifying solutions using hypothesis tests and model fitting techniques.

Analyse-it Method Validation Edition

#
#

Analyse-it Method Validation Edition

This edition is a method validation software for IVDs, Clinical Laboratories and Researchers to validate, verify, and demonstrate analytical and diagnostic method performance.
 

Supporting the latest CLSI and industry-recognised protocols, Analyse-it Method Evaluation lets you meet CLIA, CAP, JCAHO & ICH-Q2A/B analytical method validation requirements to validate, verify and demonstrate analytical accuracy, precision, linearity, recovery, reference intervals, and diagnostic performance.

  • IVD companies can validate performance during development or when compiling final analytical performance claims for regulatory compliance.

  • Researchers can verify methods meet the manufacturer's analytical and diagnostic performance claims.

  • Laboratories can demonstrate performance of a new method to meet CLIA requirements, or demonstrate performance is back on track after a proficiency test failure.
     

Analyse-it is now used by Abbott Diagnostics, Astra-Zeneca, Beckman Coulter, the FDA, Glaxo-Smith-Kline, Johnson & Johnson, Pfizer, and Roche, to name just a few. Advantages of the software include:

  • Easy-to-use data-entry templates for use by laboratory staff.

  • Accurate & reliable, avoiding tedious, error-prone hand calculations.

  • Print-ready reports, easily distributed to key laboratory staff by e-mail.

  • Runs as an add-in to Microsoft Excel, so there's virtually no learning curve.

  • A proven product, cited in hundreds of peer-reviewed papers over the last 10 years.

  • Includes all the statistics from the Analyse-it Standard edition.


Statistics and charts you need

Analyse-it Method Evaluation edition provides all the procedures you need to establish and demonstrate method:

  • Accuracy – visualise and compare the analytical accuracy of two methods, or verify accuracy is within goal or meets manufacturer's claim. Satisfies CLSI EP-9, EP-12, EP-15, EP-21, and includes Deming regression, Weighted Deming regression, Passing & Bablok and Bland-Altman bias plots.

  • Precision – visualise and determine analytical precision over days, runs or concentrations, or verify precision is within goal or meets manufacturer's claim. Satisfies CLSI EP-5, EP-15.

  • Linearity – visualise and examine linearity and reportable range, verify linearity is within goal or meets manufacturer's claim. Satisfies CLSI EP-6.

  • Test performance – visualise and determine diagnostic performance, compare diagnostic performance of multiple methods, and analyse performance of specific decision levels. Satisfies CLSI EP-12, and includes ROC curve analysis and Delong ROC Curve comparisons.

  • Reference intervals – visualise and establish reference intervals, or verify an existing interval. Satisfies CLSI-28 and IFCC-EPTRV.


A proven reliable report

Analyse-it has been available for over 10 years, is used by tens of thousands of customers world-wide, and is cited in hundreds of published peer-reviewed papers.
 

Analyse-it is validated against published datasets, many published in research by the authors of procedures, and also against other software. With independent validation performed by many of our customers before implementation, you can sure that Analyse-it is reliable and trustworthy.


Easy to use, with help along the way

Full help is included with Analyse-it, written in easy-to-understand plain English. Statistical jargon is avoided wherever possible. Step-by-step instructions guide you through using Analyse-it, and help you interpret the statistics and charts. The Getting Started tutorial mean you will be up-and-running with Analyse-it is less than 10minutes. Of course if you get stuck our widely-praised customer support are here to help. Most queries are answered quickly, with almost all answered within 24 hours.
 

Work within the familiar Excel environment

Why learn how to use a complex statistics package? Staying in the familiar Excel environment means there is virtually no learning curve! Analyse-it integrates into Excel ’97 to 2007 and analyses data directly from your worksheet. You don't have to export your data to another package, and won't end up with your data locked into an in-accessible, proprietary, file format. With your data in Excel you can easily exchange data with colleagues. Analyse-it's perfectly formatted reports means you can print the analysis results immediately, or copy-paste charts and statistics into your own documents or presentations. Chart look is based on the most popular formats used in published research, so charts are immediately ready for inclusion into research. Once analysed, your analysis can be saved as a standard Excel workbook, forwarded to colleagues, and even re-opened later and updated. Data can be added, corrected, included or excluded as outliers and the analysis updated to re-analyse the dataset.

Analyse-it Ultimate Edition

#
#

Analyse-it Ultimate Edition

All the power of Analyse-it, combining all the features of the other editions.