Centurion XIX

STATGRAPHICS Centurion is a powerful data analysis tool that combines a broad range of procedures with brilliant interactive graphics to provide an integrated analytical environment that can be applied in every aspect of business operations, from Six Sigma management protocols to quality control initiatives. It is designed with advanced statistical functionality, significant enough for use by the most seasoned statisticians, yet its incredibly intuitive interface provides simplicity sufficient to allow even a novice analyst to perform complex procedures.
Six Reasons to Select STATGRAPHICS Centurion

1. Time is money, especially when it's yours. With STATGRAPHICS intuitive interface and dynamic data handling, you'll cut your analysis time dramatically.
2. Statistics doesn't need to be a foreign language. The StatAdvisor interprets statistical output in clear, concise terms that won't leave you wondering about the significance of your results.
3. Most data don't come from a textbook. STATGRAPHICS was designed for use outside the classroom, where data aren't always normal, or independent, or free from outliers.
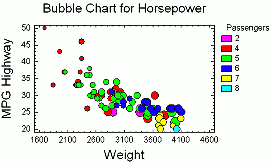
4. Graphs shouldn't be an afterthought. In STATGRAPHICS, graphs are an integral part of the analysis, used to provide insights that can't be gained from tabular displays.
5. Knowledge is power, but only when it's shared. The StatReporter makes it easy to copy results to other applications or to disseminate results in RTF or HTML format.
6. Achieving Six Sigma quality requires clarity of vision. Only STATGRAPHICS has the tools to translate data into knowledge and knowledge into a better bottom line.
Version 19
STATGRAPHICS Centurion XIX contains over 290 features, including a new link to Python functionality, modernized graphical user interface with a convenient feature-locating ribbon bar, a procedure dashboard, big data capability and so much more.