
Origin

Subscribe to Origin News & Updates
Origin provides a data analysis and graphing workspace for scientists and engineers. Multi-sheet workbooks, publication-quality graphics and standardised analysis tools provide a tightly integrated workspace for you to import data, create and annotate graphs, explore and analyse data, and publish your work. To ensure that Origin meets your data analysis requirements, intuitive tools for advanced statistics, regression, nonlinear curve fitting, signal processing, image processing and peak analysis are built-in.


Summary of Features
Origin 2026b
- Powerful Data Analysis
- Quality Graphing
- Programming Tools
- Includes Home Use
- Windows Only
- Floating or Nodelocked
OriginPro 2026b
- All of Origin Features
- + Peak & Surface Fitting
- + Statistics & more
- Includes Home Use
- Windows Only
- Floating or Nodelocked
More Resources
Key Features of Origin 2024
Origin 2024 Highlights Video
Origin 2024 - Origin vs Origin Pro
Origin Licensing Options
Origin Maintenance
Editions
Click on the Edition to see more information and pricing
Origin 2026b
Origin 2026b
 Origin is a user-friendly and easy-to-learn software application that provides powerful data analysis and publication-quality graphing capabilities tailored to the needs of scientists and engineers.
Data Analysis
Origin contains powerful tools for all of your analytic needs, including peak analysis, curve fitting, statistics, and signal processing. To make data analysis more efficient, Origin supports many common formats for importing data, and exporting results. Multi-sheet workbooks and an integrated Project Explorer help you organize your Origin projects. Streamline your workflow by saving workbooks as analysis templates for repeat use.
Graphing
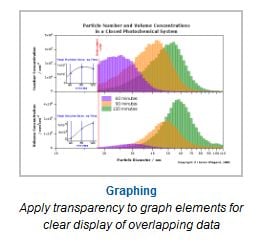
With over 70 built-in graph types, Origin makes it easy to create and customize publication quality graphs to suit your needs. Many popular contour, 2D, and 3D graph types are supported, as are specialty graphs such as windrose, stock (OHLC), ternary (including ternary-contour), 2D vector and 3D vector, and several statistical plots.
Programming
Origin includes two built-in programming languages: Origin C, a C-based compiled language, and a scripting language called LabTalk™. Use them to automate graphing and analysis. Origin comes with an Integrated Development Environment (IDE), Code Builder, that makes it easy to write and debug your own code. Origin is also an Automation Server for users of VB, C++, C# and LabVIEW™.
New in OriginPro 2022
The below highlights some of the new features for Origin 2022.
1) Object Manager: Mini Toolbars and Graphic Objects
2) Add Notes to Worksheet Cells
3) Named Range and Auto Complete for Formula Entry
4) Insert Images to Graph as Linked File
5) Customizable Grids for Graph and Layout Pages
6) Download Templates from OriginLab Websit
To see all new features in OriginPro 2022, click here.
Origin Interface
Origin provides an easy-to-use interface including a scientific multi-sheet workbook with support for up to 90 million rows and 65527 columns per sheet. The worksheet can be extensively customized to support metadata including Sparklines, and can also include floating or embedded graphs. Workbooks can be configured as Analysis Templates and Custom Reports for automating repetitive tasks.
Workbooks, graphs, notes and other windows can be arranged in a flexible, user-defined hierarchy of folders and sub-folders in the Origin Project File (OPJ). All components of the Origin Project can be interactively accessed when the project file is opened in Origin.
Graphing
With over 100 built-in graph types, Origin makes it easy to create and customize publication quality graphs to suit your needs. Many popular contour, 2D, and 3D graph types are supported, as are specialty graphs such as windrose, stock (OHLC), ternary (including ternary-contour), 2D vector and 3D vector, and several statistical plots.
Data Analysis
Origin contains powerful tools for all of your analytic needs, including peak analysis, curve fitting, statistics, and signal processing. To make data analysis more efficient, Origin supports many common formats for importing data, and exporting results. Multi-sheet workbooks and an integrated Project Explorer help you organize your Origin projects. Streamline your workflow by saving workbooks as analysis templates for repeat use.
Programming
Origin includes two built-in programming languages: Origin C, a C-based compiled language and a scripting language called LabTalk™. Origin also integrated Python into Origin as a Scripting Language. Use them to automate graphing and analysis. Origin comes with an Integrated Development Environment (IDE), Code Builder , that makes it easy to write and debug your own code. Origin is also an Automation Server for users of VB, C++, C# and LabVIEW™.
OriginPro 2026b
OriginPro 2026b
 OriginPro offers all of the features of Origin plus extended analysis tools for Peak Fitting, Surface Fitting, Statistics, Signal Processing, and Image Handling. OriginPro is the software of choice for those who want a single data analysis and graphing solution.
OriginPro offers all of the features of Origin plus extended analysis tools in the following areas:
-
Peak Fitting
-
Surface Fitting
-
Statistics
-
Signal Processing
-
Gadgets
-
Image Processing
Peak Fitting
The Peak Analyzer tool in OriginPro provides the additional capability of finding and fitting multiple peaks in your spectra. Baseline anchor points can be customized and fit with a suitable fitting function, and the baseline fitting can be included as part of the final peak fitting process. A detailed Fit Control dialog is provided to control all aspects of peak fitting including mixed peak functions, peak centers and widths, sharing parameters, and imposing bounds and linear constraints on parameters. Graphical as well as tabular results are generated as part of the final fit report.
Surface Fitting
OriginPro can fit a 3D surface to XYZ data points. The surface and data points can be displayed together, including droplines from the points to the surface.
Statistics
OriginPro expands on the statistical analysis capabilities of Origin by providing additional tools for Descriptive Statistics, Discrete Frequency Counting, Normality Tests, Correlation Analysis, One-way and Two-way Repeated Measures ANOVA, Principal Component Analysis, Hierarchical Cluster and Discriminant Analysis, many Nonparametric Tests such as Friedman ANOVA and Two-Sample Kolmogorov-Smirnov Test and Mann-Whitney Test, Survival Analysis tools including Weibull Fit and Cox Proportional Hazard Model, ROC Curves, and Power and Sample Size Tests.
Signal Processing
Advanced signal processing features in OriginPro include Short-Time FFT (STFT), Hilbert Transform, Coherence, 2D FFT and 2D FFT-based Filtering, 2D Correlation, and Wavelet analysis.
Gadgets
Gadgets provide a quick and easy way to perform exploratory analysis on data plotted in a graph. OriginPro provides two additional gadgets: Cluster and Rise Time.
Image Processing
OriginPro offers more ways to handle your image data, including alpha blending, pixel logic, morphological filtering, and interpolated background subtraction.
